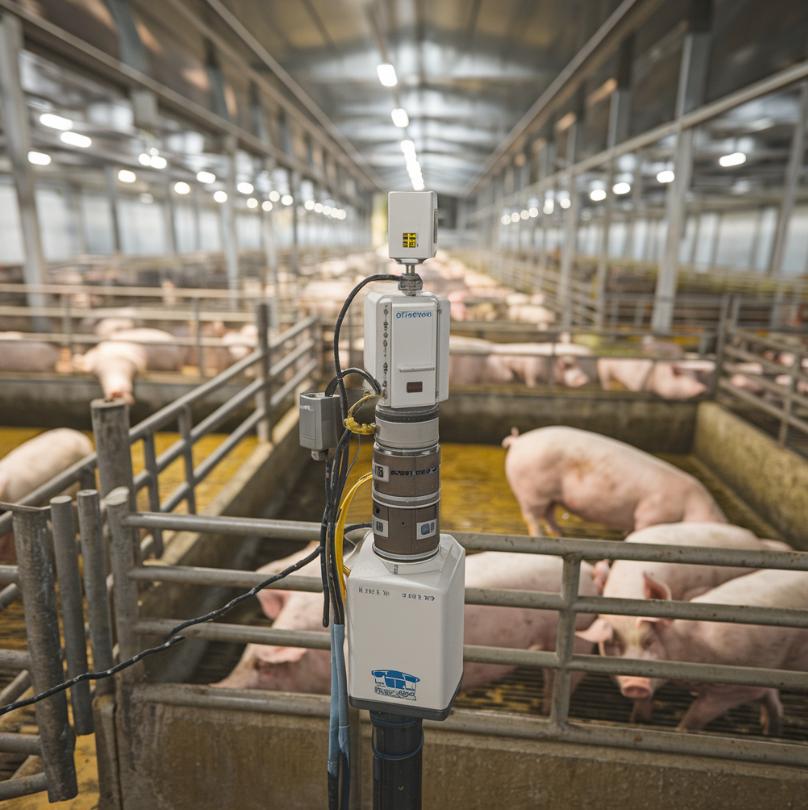
This study identifies the most significant odor compounds in pig and poultry farms to better understand odor issues and develop effective management strategies
A literature review and compound analysis revealed common substances like methanethiol and trimethylamine, as well as specific ones like hydrogen sulfide in pig farms and acetaldehyde in poultry farms. The study emphasizes the importance of proper odor management on farms to mitigate negative impacts on health and the environment.
S. Gorbeña 1, J. Aniz 1, A. Antón 2, C. Izquierdo 2, C. Díaz 2*
1 UPV/EHU, Barrio Sarriena, s/n, 48940 Leioa, Bizkaia, Spain
2 Ambiente et Odora SL, Uribitarte, 6, planta baja, Bilbao, Spain
* carlosdiaz@ambienteetodora.com
Competing interests: The author has declared that no competing interests exist.
Academic editor: Carlos N. Díaz.
Content quality: This paper has not been peer-reviewed.
Citation: S. Gorbeña, J. Aniz, A. Antón, C. Izquierdo, C. Díaz, 2024, Selection of significant odorants in the swine and poultry sector for use in instrumental odour monitoring systems and air quality monitoring indoors, ODORA24 Conference, Barakaldo, Spain, www.olores.org.
Copyright: 2024 Olores.org. Open Content Creative Commons licence. It is allowed to download, reuse, reprint, modify, distribute, and/or copy articles in Olores.org website, as long as the original authors and source are cited. No permission is required from the authors or the publishers.
ISBN: pending.
Keywords: Instrumental Odour Monitoring Systems, Pigs, Poultry, Sensors, Quality Assurance Levels, Odour Activity Value, calibration.
Abstract
This study focuses on identifying the most significant odour compounds present in pig and poultry farms. It aims to better understand the odour problem in livestock activity and to develop effective management strategies. The methodology includes a literature search and odorant analysis. The results show that some compounds are common in both types of farms, such as methanethiol and trimethylamine, while others are specific to each. In the case of pig farms, hydrogen sulfide would be an example, and in the case of poultry, acetaldehyde. This study highlights the importance of properly addressing odour management on livestock farms to mitigate negative impacts on health and the environment, emphasizing the need to develop effective strategies to control and reduce odour emissions.
1. Introduction
Animal husbandry is sometimes a source of unpleasant odours that can significantly impact their environment. The emission of odours from these agricultural facilities can negatively affect the quality of life of nearby communities and the surrounding environment (J. Hansen et al. 2016; J. Pullen. et al. 2010). It is essential to understand the magnitude and nature of this problem to develop effective odour management and mitigation strategies for livestock operations.
To effectively address the impact of animal husbandry-generated odour, it is essential to identify the odorants that contribute significantly to this phenomenon. This list of compounds would provide a more accurate understanding of the factors responsible for olfactory perception. It could also be used to design and calibrate Instrumental Odour Monitoring Systems (IOMSs), aka e-noses or o-sensors. By focusing on the most influential compounds, IOMSs could significantly improve their accuracy and efficiency in detecting and monitoring the presence of undesirable odours in the environment.
Some national Standards on IOMSs include the Dutch NTA 9055:2012, the German VDI/VDE 3518 Part 3 or the Italian UNI 11761:2019. In addition, there are other developments related to IOMSs. The Institute of Electrical and Electronics Engineers (IEEE) is working on three standards related to this topic (Diaz C., 2021). One of them, the IEEE P2520.1 Standard for Baseline Performance for Odor Analysis Devices and Systems, is in the final draft stage. After a first unsuccessful attempt (van Harreveld A. 2022), The Committee Européen de Normalisation (CEN) resumed work, but no draft has been produced yet.
However, in our opinion, none of these standards deal appropriately with the issue of calibrating these devices. That is, it is key that the IOMS devices are in line with human olfactory perception and formal smell measurements.
To date, there are only 2 European standards on this topic, the EN13725 and EN16841. Developing a validation method has been the primary focus of some groups mentioned above. However, validation has been proven to be challenging using both EN16841 (Reimringer W. Et al. 2022) or EN 13725 (Bax C. et al. 2022). One of the main challenges is that IOMS responses to samples of the same odour concentration but from different odour qualities can vary substantially.
Another important issue is that these devices should follow the 4-step verification defined in the standard EN 14181. This standard deals with Automatic Measuring Systems (AMS) and defines three Quality Assurance Levels (QAL). QAL1 relates to the instrument's certification and sets a procedure to demonstrate that an IOMS is suitable for the intended purpose before installation. QAL2 is the calibration against the standard reference method. This is made on-site. QAL3 determines whether zero and span drift are within defined limits along the time. This is usually done through the operator's continuous quality assurance procedure. Lastly, there is also an Annual Surveillance Test (AST).
Calibrating an IOMS with the reference method EN 13725 for a QAL1 is possible. However, using this methodology to carry out QAL2 and, above all, QAL3 is, in many cases, not possible. For QAL2, it is difficult to check "span". For QAL3, it is very challenging to take nine samples and carry out seven dilutions for each sample every week during the life of the IOMS to check performance during operation.
The way to overcome these difficulties is by working with odorants. The VDI/VDE 3518 Part 3 and the future IEEE P2520.1 propose a list of odorants to carry out these tasks. However, none of the odorants proposed in these standards are specific to a given sector, leaving the choice of odorants to the manufacturer. Thus, comparing devices from different manufacturers is not possible.
The relative Odour Activity Value (OAVr), sometimes called the odour index, has come as a tool to overcome some of these difficulties (Schlegelmilch M. 2008). Selecting a set of odorants relevant to a specific sector makes it possible to focus on the odorants more valuable to calibrate an IOMS for a particular industry.
One of the key sectors that needs standardisation of IOMS is the animal husbandry sector, with a clear distinction between pig- and chicken-intensive units. These agricultural facilities are recognised as sources of odour emissions due to the biological activities and processes associated with intensive animal husbandry. The choice of these two types of farms allows for a more detailed understanding of species-specific odour profiles.
Some authors have attempted this approach (Parker et al. 2012) and worked with OAVs in swine and dairy facilities for a list of 20 common odorants. Their data was based on their own chemical analysis, so the list of odorants was restricted to just 20. A systematic literature review is needed to compile a larger and comprehensive list of odorant compounds related to husbandry activities.
The aim of this retrospective study is to define a set of odorants relevant to pig and poultry farms using the OAVr methodology. The second objective is to propose a range of concentrations at which these compounds should be used as reference odorants for the QAL1, QAL2 and QAL3 calibration of IOMSs to be set in pig and poultry farms.
2. Methodology
A bibliographic search was conducted in Scopus, Researchgate, and the EHU online library at the University of the Basque Country. The terms "odorant concentration", "chicken farms", "hens farms", "poultry " ,â€swine buildings†or "pig farms" were searched. Priority was given to recent publications dealing with odour concentration measurement. Choosing relatively recent research ensures that the findings reflect the most up-to-date knowledge of odour emissions from agricultural sources. In addition, newer analytical techniques are able to detect a wider range of odorants at lower concentrations.
The results were grouped according to whether they were related to pig or poultry farms.
Odour thresholds (OTVs) for the odorants involved were identified and categorized. However, it is important to note that the odour thresholds are not always reliable, so a certain degree of confidence was assigned to each odour threshold. This approach allowed careful consideration of the validity of the data and ensured a more accurate assessment of the presence and impact of odours in this study.
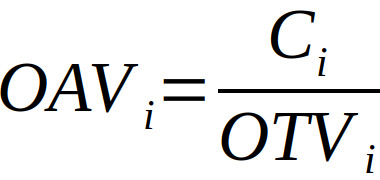
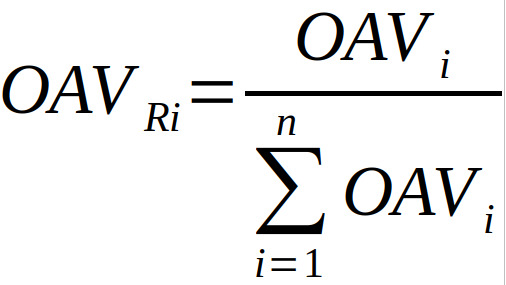
The Odour Activity Relative Value (OAVr), also called the odour index (Diaz C. 2010), was used. The OAVr is a tool to identify key compounds responsible for a given odour and their contribution. The calculation of the OAV for each component follows Equation 1 and Equation 2 is the percentage contribution.
 |
(1) |
 |
(2) |
Where OAVi is the odour index of compound i, Ci is the concentration of component i (μg/m³), OAVRi: relative odour index (%), OTVi: odour threshold value of substance i (μg/m³) y n: number of odorous substances identified in the sample.
Finally, the odorants that cause 98% of the odour in each investigation have been selected and compiled in a final table.
In order to find out the appropriate concentrations of the odorants to be tested in ambient air, their respective odour guide values (OGV) were calculated following the German approach to evaluate complaints about odour annoyance in indoor air (David et al. 2024). This methodology uses the equation (3) to obtain the OGV. Where kw is the Weber-Fechner coefficient and OTV is the odour threshold value.
 |
(3) |
For a substance for which no experimentally determined kW value of its own is available, the value of 2,6 is used as default value.
3. Results
The following articles were selected for this systematic review: (1) M. J. Hansen et al. 2016; (2) M. J. Hansen et al. 2012; (3) A.K. Gralapp et al. 2000; (4) Phung D. Le et al. 2005; (5) James Zahn et al. 2001; (6) Sung-Chul Seo et al. 2023; (7) J.K.Jiang et all. 2000; (8) J. Pullen.2010; (9) Yun-Ji Heo. 2023
3.1 Odorants from swine units
The following tables show the information collected on odorants in pig farms, their measured concentrations, the OTVs and the contribution of each one by OAV. The selection of odorants responsible for 98% of the odour in each investigation was made in order to discard less significant compounds. In some cases, it was not possible to find the odour threshold of the compound, so an incomplete information error was assumed, which could change the final result.
Table 1. List of significant odorants from M. J. Hansen et al. 2016 in ventilation air.
|
Odorants from swine farms |
Concentration (μg/m³) |
OTV (μg/m³) |
OAV |
OAV (%) |
|
Hydrogen sulfide |
817.95 |
0.580 |
1409.756 |
26.224 |
|
Trimethylamine |
73.67 |
0.079 |
937.500 |
17.439 |
|
C5-carboxylic acids (e.g..valeric acid) |
106.14 |
0.157 |
675.676 |
12.569 |
|
Indole, 3-methyl- |
3.27 |
0.005 |
600.000 |
11.161 |
|
Methanethiol |
37.96 |
0.070 |
542.270 |
10.087 |
|
4-methylphenol |
71.92 |
0.135 |
533.333 |
9.921 |
|
Butanoic acid |
391.91 |
1.000 |
391.909 |
7.290 |
|
Indole |
7.30 |
0.063 |
115.385 |
2.146 |
|
Acetic acid |
1278.61 |
15.000 |
85.241 |
1.586 |
|
OTV: ambi23A, Nagata, Key odorants |
||||
Table 2. List of significant odorants from M. J. Hansen et al. 2016 in the piggery.
|
Odorants from swine farms |
Concentration (μg/m³) |
OTV (μg/m³) |
OAV |
OAV (%) |
|
Hydrogen sulfide |
682.09 |
0.580 |
1175.610 |
27.096 |
|
Trimethylamine |
71.21 |
0.079 |
906.250 |
20.888 |
|
C5-carboxylic acids (e.g..valeric acid) |
118.87 |
0.157 |
756.757 |
17.442 |
|
Indole, 3-methyl- |
2.73 |
0.005 |
500.000 |
11.524 |
|
4-methylphenol |
44.95 |
0.135 |
333.333 |
7.683 |
|
Butanoic acid |
293.02 |
1.000 |
293.016 |
6.754 |
|
Methanethiol |
12.39 |
0.070 |
176.951 |
4.078 |
|
Acetic acid |
1168.73 |
15.000 |
77.916 |
1.796 |
|
Indole |
2.92 |
0.063 |
46.154 |
1.064 |
|
OTV: ambi23A, Nagata, Key odorants |
||||
Table 3. List of Significant Odorants from M. J. Hansen et al. 2012 Room B.
|
Odorants from swine farms |
Concentration (μg/m³) |
OTV (μg/m³) |
OAV |
OAV (%) |
|
Hydrogen sulfide |
704.74 |
0.580 |
1214634. 000 |
56.411 |
|
C5 carboxylic acids (e.g..valeric acid) |
52.94 |
0. 157 |
337.043 |
15.653 |
|
Methanethiol |
12.19 |
0.070 |
174.097 |
8.086 |
|
Trimethylamine |
11.54 |
0. 079 |
146.875 |
6.821 |
|
Butanoic acid |
142.85 |
1.000 |
142.845 |
6.634 |
|
4-methylphenol |
7.64 |
0.135 |
56.667 |
2.632 |
|
2,3-butanedione |
8.59 |
0.179 |
48.000 |
2.229 |
|
OTV: ambi23A, Nagata, Key odorants |
||||
Table 4. List of Significant Odorants from M. J. Hansen et al. 2012 Pit D.
|
Odorants from swine farms |
Concentration (μg/m³) |
OTV (μg/m³) |
OAV |
OAV (%) |
|
Hydrogen sulfide |
1266.54 |
0.580 |
2182.927 |
70.706 |
|
Methanethiol |
23.97 |
0.070 |
342.486 |
11.093 |
|
Trimethylamine |
20.87 |
0.079 |
265.625 |
8.604 |
|
4-methylphenol |
8.54 |
0.135 |
63.333 |
2.051 |
|
2,3-butanedione |
11.10 |
0.179 |
62.000 |
2.008 |
|
3-Methyl indole |
0.33 |
0.005 |
60.000 |
1.943 |
|
C5 carboxylic acids (e.g..valeric acid) |
9.26 |
0.157 |
58.983 |
1.910 |
|
OTV: ambi23A, Nagata, Key odorants |
||||
Table 5. List of Significant Odorants from A.K. Gralapp et al. 2000.
|
Odorants from swine farms |
Concentration (μg/m³) |
OTV (μg/m³) |
OAV |
OAV (%) |
|
Indole, 3-methyl- |
353.998 |
0.005 |
64924.833 |
65.262 |
|
Indole |
2085.205 |
0.063 |
32938.282 |
33.109 |
|
OTV: Key odorants |
||||
Table 6. List of significant odorants from Phung D. Le et al. 2005.
|
Odorants from swine farms |
Concentration (μg/m³) |
OTV (μg/m³) |
OAV |
OAV (%) |
|
Methanothiol |
36000 |
0.070 |
514285.714 |
98.419 |
|
OTV: ambi23A |
||||
Table 7. List of significant odorants from James Zahn et al. 2001.
|
Odorants from swine farms |
Concentration (μg/m³) |
OTV (μg/m³) |
OAV |
OAV (%) |
|
n-Valeric acid |
360 |
0.157 |
2291.828 |
48.985 |
|
4-Methyl phenol |
90 |
0.135 |
667.389 |
14.265 |
|
Butyric acid |
590 |
1.000 |
590.000 |
12.610 |
|
3-Methyl indole |
2 |
0.005 |
366.809 |
7.840 |
|
Isovaleric acid |
98 |
0.331 |
295.946 |
6.325 |
|
Isobutyric acid |
110 |
0.549 |
200.217 |
4.279 |
|
Hydrogen sulfide |
90 |
0.580 |
155.118 |
3.315 |
|
n-Caproic acid |
110 |
2.897 |
37.972 |
0.812 |
|
OTV: Nagata, Key odorants |
||||
Table 8. List of significant odorants from Sung-Chul Seo et al. 2023.
|
Odorants from swine farms |
Concentration (μg/m³) |
OTV (μg/m³) |
OAV |
OAV (%) |
|
trimethylamine |
60.16 |
0.079 |
765.625 |
27.731 |
|
N-butyric acid |
678.08 |
1.000 |
678.080 |
24.560 |
|
hydrogen sulfide |
272.70 |
0.580 |
470.000 |
17.023 |
|
Methanethiol |
20.64 |
0.070 |
294.823 |
10.678 |
|
N-valeric acid |
43.22 |
0.157 |
275.135 |
9.965 |
|
I-valeric acid |
67.52 |
0.331 |
203.903 |
7.385 |
|
propionic acid |
1073.38 |
17.556 |
61.140 |
2.214 |
|
OTV: ambi23A, Nagata, Key odorants |
||||
3.2 Odorants from poultry units
The following tables show the collected information on odorants in poultry buildings, their measured concentrations, the OTV-s and the contribution of each one by OAV. Tables detailing the list of odorant compounds selected according to the criterion that they represent 98% of the odour concentration in poultry farms are shown.
Table 9. List of significant odorants from J.K.Jiang et all. 2000.
|
Odorants from poultry house |
Concentration (μg/m³) |
OTV (μg/m³) |
OAV |
OAV (%) |
|
Methanethiol |
9.490 |
0.070 |
135.567 |
76.110 |
|
Acetaldehyde |
35.895 |
2.750 |
13.053 |
7.328 |
|
Dimethyl disulfide |
107.311 |
8.620 |
12.449 |
6.989 |
|
Ethylmercaptan |
0.129 |
0.030 |
4.301 |
2.415 |
|
Butyric acid |
3.704 |
1.000 |
3.704 |
2.079 |
|
Acetic acid |
47.488 |
15.000 |
3.166 |
1.777 |
|
Propylmercaptan |
0.063 |
0.040 |
1.582 |
0.888 |
|
Dimethyl sulfide |
10.318 |
8.000 |
1.290 |
0.724 |
|
OTV: ambi23A, Nagata |
||||
Table 10. List of significant odorants from J. Pullen.2010.
|
Odorants from poultry house |
Concentration (μg/m³) |
OTV (μg/m³) |
OAV |
OAV (%) |
|
2,3-Butanedione |
81 |
0.179 |
452.583 |
65.562 |
|
Butanoic acid |
78 |
1.000 |
78.000 |
11. 299 |
|
3-Methyl butanoic acid |
14 |
0.331 |
42.278 |
6. 124 |
|
Trimethylamine |
3,2 |
0.079 |
40.722 |
5. 899 |
|
Acetic acid |
530 |
15.000 |
35.333 |
5. 118 |
|
Pentanoic acid |
3 |
0.157 |
19.099 |
2. 767 |
|
3-Methyl butanal |
5,6 |
0.358 |
15.645 |
2. 660 |
|
OTV: ambi23A, Nagata, Key odorants |
||||
Table 11. List of significant odorants from Yun-Ji Heo. 2023.
|
Odorants from poultry house |
Concentration (μg/m³) |
OTV (μg/m³) |
OAV |
OAV (%) |
|
Trimethylamine |
89877. 633 |
0. 079 |
1143750 |
99. 969 |
|
OTV: Key odorants |
||||
3.3 List of odorants and concentratuions for its use in QAL1, QAL2, and QAL3 evaluations of IOMSs
Finally, two final tables have been compiled, one for each type of animal, grouping the most recurrent odorants following the calculation of the OAV and selecting only those odorants that contribute to the 98% of the total odour. Odorants included in 2 or more papers within the 98% percentage of contribution were selected.
Table 12. Selection of the most significant odorants from pig farms for its use in QAL1, QAL2 and QAL 3 calibration of IOMSs
|
Odorant |
Kw |
OGV (μg/m³) |
|
Hydrogen sulfide |
2.6 |
5.34 |
|
Trimethylamine |
2.39 |
0.87 |
|
N-valeric acid |
2.6 |
1.45 |
|
Indol, 3-metthyl-(skatole) |
2.6 |
0.05 |
|
Methanethiol |
2.6 |
0.64 |
|
4-methylphenol |
2.6 |
1.24 |
|
Butanoic acid |
2.6 |
9.20 |
|
Indole |
2.6 |
0.58 |
|
I-valeric acid |
2.6 |
3.05 |
Table 13. Selection of the most significant odorants and suitable concentrations from poultry farms for its use in QAL1, QAL2 and QAL 3 calibration of IOMSs
|
Odorant |
kw |
OGV (μg/m³) |
|
trimethylamine |
2.39 |
0.87 |
|
Methanethiol |
2.6 |
0.64 |
|
Butanoic acid |
2.6 |
9.20 |
4. Discussion
Tables 12 and 13 are the first attempt, that we know, to try to find a list of odorants suitable to be used in QAL1, QAL2 and above all QAL3.
Both tables show a variety of odorant compounds present on pig and poultry farms. There are significant differences in the specific compounds listed. For example, Table 12 highlights compounds such as hydrogen sulfide and indole, while Table 13 includes compounds such as acetic acid and 2,3-butanedione. On the other hand, there are similarities in the components of the two tables. Both tables show the presence of compounds such as volatile organic acids and sulphur compounds.
A limitation of this study is that the use of the OAVr implies that only those compounds that have a major contribution to the overall odour are taken into account, however, there may be other odourless compounds that are more representative of the odour in an animal farm.
In this paper, we specifically avoided to sum OAVs to try to get some sort of prediction of odour concentration, as in our opinion, that is not the way to work with OAVs. Other authors have tried to do so with very poor results (Parker et. al. 2012).
The list of compounds described in this paper are not meant to replace the human sense of smell or an olfactometric measurement. If after monitoring all these compounds, no presence of them is registered and odour is still detected, then other approaches should be taken.
There is a need to work on the vapour pressure of these compounds in order to find out if it is possible to prepare a calibration mixture of these compounds in a bottle.
5. Conclusions
Based on the methodology described, the OAV has been adopted to calculate which are the most representative odorant compounds of odour emission in animal farms.
In pig farms, the most representative odorants are H2S, trimethylamine, n-valeric acid, indole, methanethiol, 4-methylphenol, butanoic acid, indole and I-valeric acid. Following the German approach for indoor air, these odorants could be used for QAL2 and QAL3 calibration of IOMSs at concentrations of 5.34 μg/m³, 0.87 μg/m³, 1.45 μg/m³, 0.05 μg/m³, 0.64 μg/m³, 1.24 μg/m³, 9.20 μg/m³, 0.58 μg/m³ and 3.05 μg/m³, respectively.
In poultry farms the most representative odorants are trimethylamine, methanethiol and butanoic acid.
Following the German approach for indoor air, these odorants could be used for QAL2 and QAL3 calibration of IOMSs at concentrations of 0,87 μg/m³, 0.64 μg/m³ and 9.20 μg/m³, respectively.
According to the proposed methodology, by generating a bottle with these concentrations, it will be possible to carry out the QAL 2 and QAL3 procedures for any IOMS installed in concentrated animal feeding operation.
There is a need to work on the vapour pressure of these compounds in order to find out if it is possible to prepare a calibration mixture of these compounds in a bottle.
6. References
ATSDR. MMG for Methyl Mercaptan (Sulfuric acid) PHS . (n.d.).
ATSDR. Public Health Summary: Hydrogen Sulfide (Hydrogen Sulfide) (in spanish)PHS . (n.d.).
Bax C., Lotesoriere B., Capelli L., 2022, IOMS for the real-time monitoring of odour concentration at a MSW landfill. Olores.org. Link
ChemEurope. Valeric_acid. (n.d.)
M. David, K. Sucker, J. Hameister, F. Gerull, H. Grams, C. Röhl, K. Schröder, L. Brosig, A.M. Scutaru, M. Debiak, M. Kolossa-Gehring, The German approach to evaluate complaints about odour annoyance in indoor environments, Indoor Environments,Volume 1, Issue 3, 2024, 100020, ISSN 2950-3620, https://doi.org/10.1016/j.indenv.2024.100020.
Diaz C., 2010, Método para determinar y caracterizar los compuestos más relevantes en las emisiones de olor en procesos industriales. Olores.org. Link
Diaz C., 2021, IEEE looks for Standardization Volunteers. Olores.org. Link
Ente Nazionale Italiano di Unificazione. (2019). UNI 11761:2019 - Emissioni e qualità dell'aria - Determinazione degli odori tramite IOMS (Instrumental Odour Monitoring Systems)
European Committee for Standardization. (2014). EN 14181:2014 Stationary source emissions - Quality assurance of automated measuring systems
Gralapp, A. K., Powers, W.J., & Bundy, D.S., 2000, Comparison of olfactometry, gas chromatography, and electronic nose technology for measurement of indoor air from swine facilities.
GuideChem Encyclopedia (n.d.)
Guidechem, Security testing. (n.d.)
Hansen, M. J., Adamsen, A. P. S., Feilberg, A., Jonassen, K. E. N. & Lokke, M.M., 2016, Multivariate prediction of odor from pig production based on in-situ measurement of odorants.
Hansen, M. J., Adamsen, A. P. S., Feilberg, A., Jonassen, K. E. N. & Pederson, P., 2012, Prediction of odor from pig production based on chemical odorants.
Hansen, M. J., Kasper, P.L., Adamsen A.P.S. & Feilberg, A., 2017, Key Odorants from Pig Production Based on Improved Measurements of Odor Threshold Values Combining Olfactometry and Proton-Transfer-Reaction Mass Spectrometry (PTR-MS).
Heo, Y.-J., Park, J. Kim, Y.-B., Kwon, B.-Y., Kim, D.-H., Song, J.-Y., & Lee, K.-W. ,2023, Effects of dietary protein levels on performance, nitrogen excretion, and odor emission of growing pullets and laying hens.
Jiang, J., & Sands, J.,2000, Odour and ammonia emission from broiler farms. RIRDC Project UNS-11A, Rural Industries Research and Development Corporation, Canberra.
KUNSHAN ODOWELL CO., LTD. 2,3-butanodiona. (n.d.).
Le, P. D., Aarnink, A. J. A., Orginik N. W M., & Verstegen, M. W. A., 2005, Odour from animal production facilities: Its relationship to diet.
Nagata, Y., 2013, Measurement of Odor Threshold by Triangle Odor Bag Method.
Nederlands Normalisatie-instituut. (2012). NTA 9055:2012 - Luchtkwaliteit - Elektronische luchtmonitoring - Geur(overlast) en veiligheid (Air quality Electronic air monitoring – Odour (nuisance) and safety).
New Jersey department of health. Acethaldeide. (n.d.).
Parker, D. B., Kozieł, J. A., Cai, L., Jacobson, L. D., Akdeniz, N., Bereznicki, S. D., Lim, T. T., Caraway, E. A., Zhang, S., Hoff, S. J., Heber, A. J., Heathcote, K. Y., & Hetchler, B. P., 2012, Odor and Odorous Chemical Emissions from Animal Buildings: Part 6. Odor Activity Value. Transactions Of The ASABE
Pullen, J. & Spinks, A., 2010, . Odour assessment of an intensive livestock facility.
Reimringer W., Joppich J., Leidinger M., Conrad T., Mannebeck B., Mannebeck C., Schütze A., 2022, Field test evaluation of instrumental odour monitoring systems with a novel in-situ calibration approach. Olores.org. Link
Seo, S.-C., Lee, Lee W-J., & Kim, K.-Y. , 2023, Temporal distribution characteristics of odorous compounds in swine houses of South Korea.
Schlegelmilch M., 2018, GERUCHSMANAGEMENT - Methoden zur Bewertung und Verminderung von Geruchsemissionen. Technische Universität Hamburg, DOI: https://doi.org/10.15480/882.493
Van Gemert, L.J., 2003, Compilations of odour threshold values in air, water and other media. Boelens Aroma Chemical Information Service, Hui- zen, The Netherland
van Harreveld T., 2022, The long and winding road of CEN/TC264/WG41 developing a standard for validating Instrumental Odour Measurement Systems. Olores.org. Link
VDI/VDE-Gesellschaft Mess- und Automatisierungstechnik. (2018). VDI/VDE 3518 Blatt 3:2018 - Multigassensoren - Geruchsbezogene Messungen mit elektronischen Nasen und deren Prüfung (Multigas sensors - Odour-related measurements with electronic noses and their testing)
Zahn, J. A., Hatfield, J. L., Dispirito, A., & Brooks, B. E., 2001, Correlation of human olfactory responses to airborne concentrations of malodorous volatile organic compounds emitted from swine effluent.
See the full article in other languages:
- French
- Spanish
- German
- Polish
- Arabic